
1.Requirements

- Compatible with Unity 2017.x , 2018.x, 2019.x and 2020.x.
- Works with >.Net 2.0 and IL2CPP.
- Works with Native rendering, URP and HDRP.
- Supports all platforms (PC, Mac, Linux, Android, IOS, WebGL, etc).
- Can be used in Editor and Build.
2.Getting Started
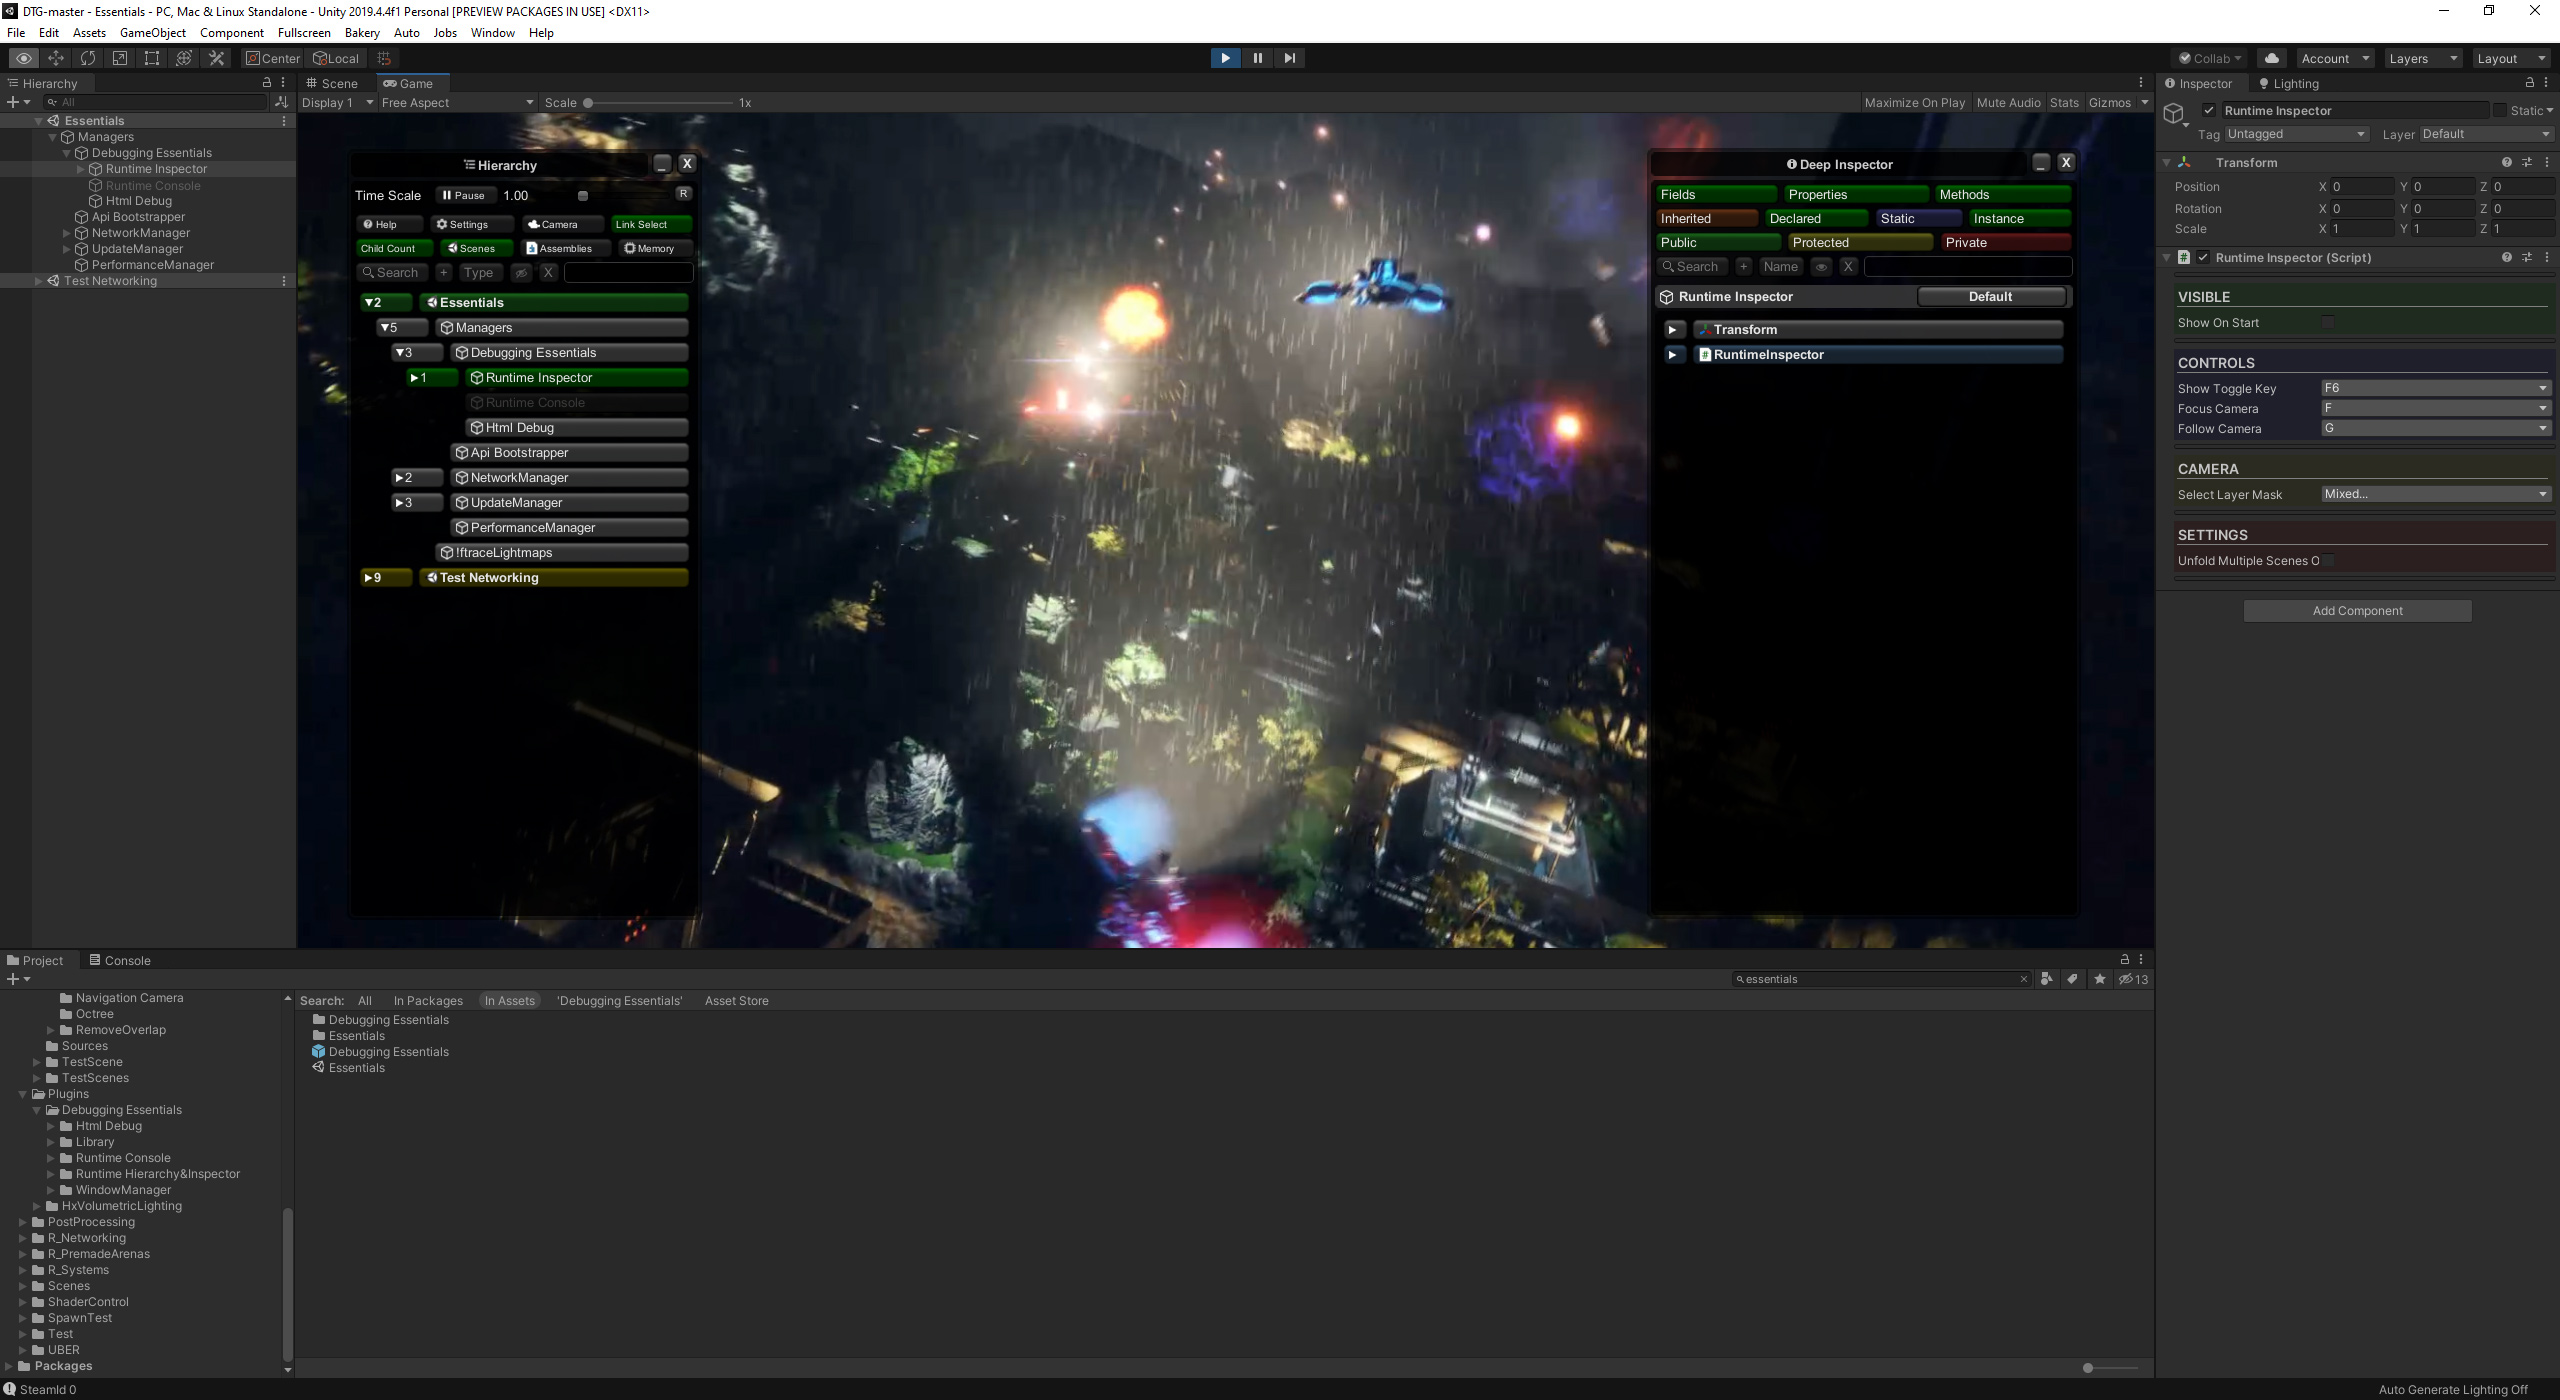
All you need to do is go to the ‘Plugins/Debugging Essentials’ folder and drag & drop the ‘Debugging Essentials’ prefab into your main Scene. Make sure you always use one instance only of this prefab.
You can unfold the ‘Debugging Essentials’ GameObject in your Scene and click on the ‘Runtime Inspector’, ‘Runtime Console’ to set them up. For both you can choose a keyboard key to show/hide them or make them appear on Start. The ‘Html Debug’ log also has some settings.
For everything to work you need to go inside play mode in the Unity Editor or run a Build.
I created ‘Debugging Essentials’ for our game D.R.O.N.E. and I use it all the time to increase development speed. Btw we have a free demo on Steam that you can try out to get an idea what we are creating…
3.Runtime Hierarchy
Real-time
Both the Hierarchy and Deep Inspector window update in real-time. This is very handy to see e.g. the active state of your GameObjects.
E.g. on our projectiles I use raycast culling with Unity’s multi-threaded raycast jobs. I shoot a ray from the camera to the projectile to see if it can be reached, this doesn’t need to be accurate because projectiles travel very fast and you don’t notice not seeing them for a frame. I made a pooling system for this and because the Hierarchy window is real-time I noticed that I first activate the projectile, call the culling function and then immediate deactivate it (if not visible) once that result returns a frame later. So I optimized not to activate before the culling result. The Unity Hierarchy window didn’t show this as probably it has some drawing delay as this was only happening for 1 frame…
Controls
The Hierarchy window works pretty similar like the Unity Hierarchy window, only the controls are slightly different and there’s a neat fold-out/fold-in feature. To see the controls click on the ‘Help’ button in the Hierarchy window.
To show the Deep Inspector window you need to select an object. When the ‘Link Select’ button is active (Editor only) the selected object will be linked to selected object in the Unity Hierarchy window or Project window. The object you select can be a GameObject (in Scene mode), Assembly class (in Assembly mode), Any object that inherits from UnityEngine.Object (in Memory mode).
You can drag both windows around by dragging the window title bar. The Deep Inspector window can be docked to the Hierarchy window by shift clicking the ‘Deep Inspector’ title bar. The windows can be resized by dragging the edges.
Also there’s a minimize button for each window and the ‘X’ button will close both windows which has the same functionality as the show toggle key.
Activate/Duplicate/Destroy
The active state of GameObjects can toggled by shift clicking them. To duplicate use ‘Control’ + ‘D’ and ‘Delete’ key for deleting. Being able to toggle GameObjects active/in-active can be very handy to test performance in a build to see which gives most overhead. Also it can be handy for making screenshots, e.g. you’d like to hide a certain GUI, etc.
Time Scale
With the ‘Time Scale’ slider and ‘Pause’ button you can control the time-scale. For Deep Inspection it can be handy to slow-mo or pause your game. Pausing the game means that Unity’s time-scale is on 0.
Camera
With the ‘Camera’ button you can override your camera and navigate through your Scene with the same controls as in the Unity Scene window. This still works after you pause your game with the ‘Pause’ button or ‘Time Scale’ slider all the way to the left.
By the way, this is a neat side feature to make screenshots for your game as you can pause in the middle of the action and particles etc will be frozen, then with the camera you can navigate around your Scene. You can change the field of view of the camera with the ‘FOV’ slider. We made our Steam Page screenshots using this feature.
You can select GameObject colliders by clicking on them. It uses a raycast and the layermask for it can be setup in the Unity Inspector window (‘Select Layer Mask’) on the ‘Runtime Inspector’ GameObject.
To focus on the selected GameObject press ‘F’ on your keyboard. Press ‘G’ to follow it. These keys are selectable in the Runtime Inspector settings (in Unity’s Inspector window).
After we introduced our AI bots our multiplayer finally started working, as before we simply didn’t have enough concurrent players, almost all reviews were mentioning ‘No Players’. However after the bots some bad reviews were coming in bringing our recent 86% very-positive average down to a dangerous mixed ~58%. We had connection issues, floating missiles, sticky bombs not working correctly, scoreboard not syncing correctly, invisible players, players that had unlimited health, team colors not working correctly so teams attacked their own players, etc. What made it a lot more complicated was the host-migration. Discovering the cause of those bugs was almost impossible as to reproduce them I needed multiple offline builds and doing a few host-migrations, reproducing took time and when I was able to do, I simply couldn’t look up the state of the variables I needed to look into. So I was loosing days in trying to figure out what was going wrong, remaking new builds each time. That made me decide to develop the Runtime Inspector. So after developing the Runtime Inspector I was able to fix those bugs quickly. Also we were getting reviews complaining about gameplay, so I used the ‘G’ follow key after selecting a player in the Hierarchy window to see the behavior of new players that entered the game. I could see that they are new as in the Deep Inspector everything is exposed, so I can see XP level, backer level, etc. I noticed that they were really noobs and that our bots were too difficult for them and that those reviews were probably rage-quits. So I tweaked the bots to be more easy at the beginning and getting more difficult based on a player’s XP level. This change and the bug fixes recovered our recent reviews…phew….and as for the time of writing they are at 100%.
Child Count
Enabling this button will show the child count of each GameObject, which is updated in real-time.
When we introduced our AI Bots in multiplayer my team-mate complained certain arenas had performance issues. With this feature I found this issue was a bug with our projectile pooling, after a certain distance I didn’t spawn the particles only the audio/decal, but I forgot to despawn the projectile on this condition. I saw the child count keep increasing. So our projectiles were accumulating in bigger arenas bringing the performance to it’s knees.
Scenes Mode
The Scene Mode is the default mode and shows the same as the Unity Hierarchy window showing all the loaded Scenes with their GameObjects.
Assemblies Mode
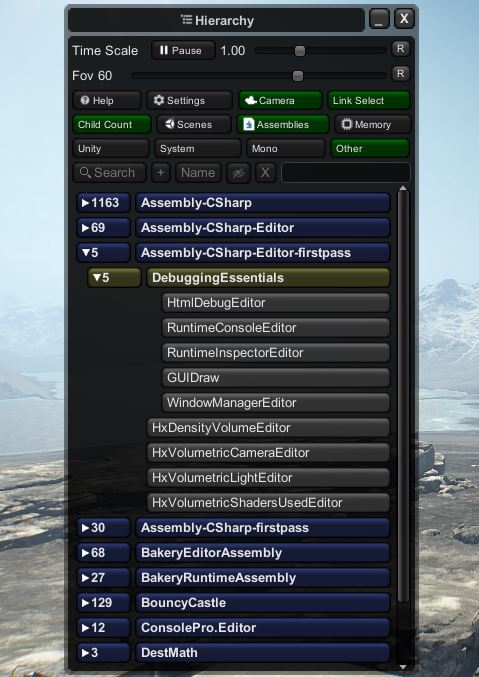
If you use classes that are static-only, they can be found in the Assemblies mode. Also if instances of a class are only referenced in a static class, they can be found in Assemblies. As soon as you click the ‘Assemblies’ button 4 categories buttons will appear. Unity/System/Mono and Other. Those contain all the assemblies that are present and I sort them based on their name into those categories. Unity compiles all scripts into the ‘Assembly-CSharp’ in the ‘Other’ category. If scripts are inside any folder named ‘Plugins’, Unity will compile them into the ‘Assembly-CSharp-firtpass’. All editor scripts Unity compiles into the ‘Assembly-CSharp-Editor-firstpass’.
E.g. our web-dev made his entire web-api that communicates with our drone server and Steam networking with instance classes that are only references in his static classes, so to see the state of the web-api we need to check it in Assemblies.
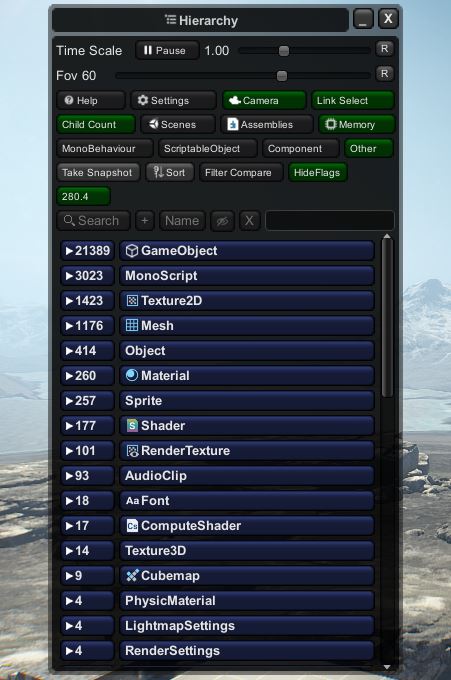
Memory Mode
In memory mode you can take snapshots that contain all current Unity objects (UnityEngine.Object) in memory. Internally this uses ‘Resources.FindObjectsOfTypeAll’. The objects are sorted in categories (MonoBehaviour, ScriptableObject, Component, Other) and types. The HideFlags button will show an icon for each Object.hideFlags setting. The objects inside a snapshot don’t all originate from your Scenes, they also include prefabs, scriptable objects, textures, etc that are referenced from your project. You can sort the types alphabetically or by child count with the sort button. So this gives you a nice overview of which Unity Objects are in memory and you can compare snapshots to check for memory leaking. Memory leaking is happening when Objects are not used anymore while not being destroyed in memory. It can e.g. happen with a GameObject pooling system where only GameObjects are instantiated but not Destroyed, etc. RenderTextures, Texture2D/3D and Meshes that are created by code need to be destroyed by code as well. Many developers overlook this and it can cause these types to leak in memory. Textures can take a lot of memory and this can cause the GPU memory to get full, which can lead to performance drops (texture swapping) and ultimately a black screen. E.g when developing TerrainComposer 2 (which runs entirely on the GPU), I had RenderTextures leaking causing my windows screen to turn black after some time and only a restart would fix it. Back then I made a similar but more simple memory inspector to solve this.
Also the tricky part of e.g. RenderTextures is that they need to be destroyed in a certain way: RenderTexture.Release() => Object.Destroy(RenderTexture) => RenderTexture = null.If not done correctly it will either cause leaking on GPU or CPU side, where the GPU leak is the most serious one. On the CPU side a RenderTexture doesn’t use much memory. I included the ‘GraphicsHelper’ class with Dispose methods which you can use to destroy these types and be sure that it will be done correctly.
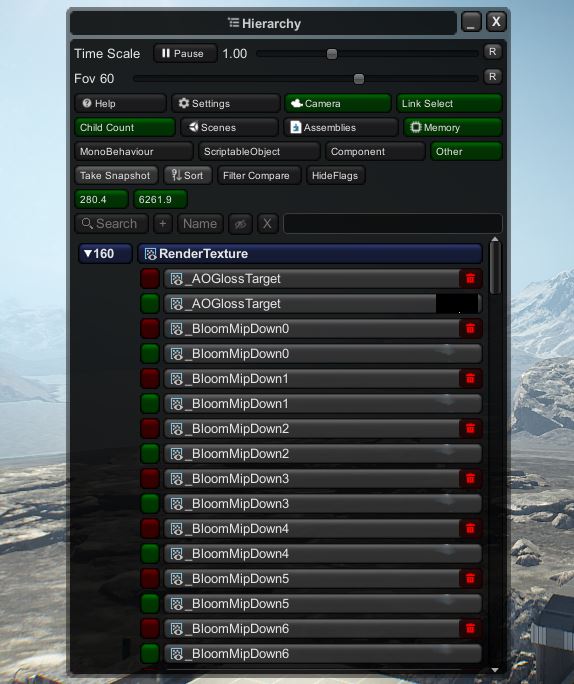
For testing for leaking you can compare 2 snapshots. E.g. if you load a Scene => Take snapshot, then unload the Scene, then load it again => Take snapshot. Shift click on the older snapshot to make the compare. The red button before the name means it’s the old object that got removed (from the newer snapshot) and the green the new object that got added (from the old snapshot). The dustbin icon means that the object is destroyed and not available anymore in memory. With the ‘Filter Compare’ button enabled the names are compared of a remove and added object, if they are the same both are removed. To make sure that objects are really accumulating you can do more e.g. => unload Scene, load again => unload => load => take snapshot => filter compare.
Keep in mind that this is only for quickly checking for memory leaks on all Unity Objects, but for the C# side classes that don’t inherit from UnityEngine.Object you have to use Unity’s memory profiler for detecting leaks. The C# side cannot be done from within Unity and needs an outside process to capture the memory.
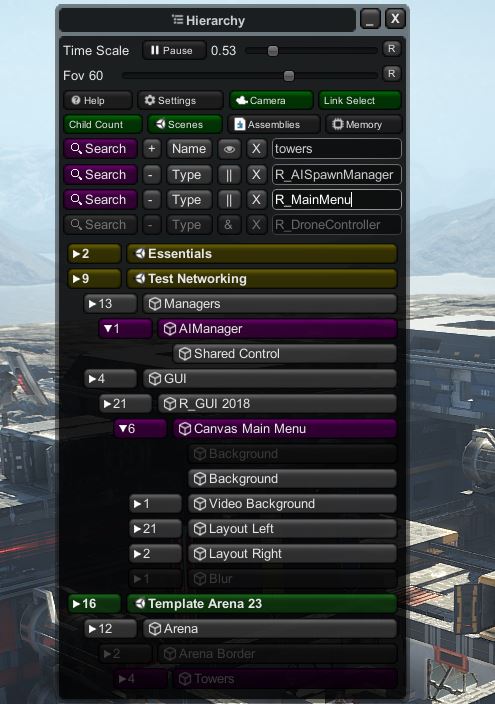
Searching inside the Hierarchy Window
You can search GameObjects in the Hierarchy window by name or by type. For type in Scene mode the GameObject’s components will be searched for matching. For types the search text will get red if the type cannot be found. You can have multiple search conditions based on type/name and with the condition AND(&) / OR (||). To add another search option click the ‘+’ button, to remove click the ‘-‘ button. The search can be activated/deactivated clicking the ‘Search’ button. Click the ‘X’ button to delete the search text. The found objects will be highlighted in purple. There are two search result display modes that can be switched with the eye button. With the eye showing will unfold everything that is unfolded, while the invisible eye will only show the found objects and their parents. Searching for both Hierarchy and Deep Inspector is done with a Coroutine for frame-rate to stay interactive. The amount of Assemblies / Hierarchy GameObjects / Inspector Fields to search per frame can be selected clicking the ‘Settings’ button.
4.Runtime Deep Inspector
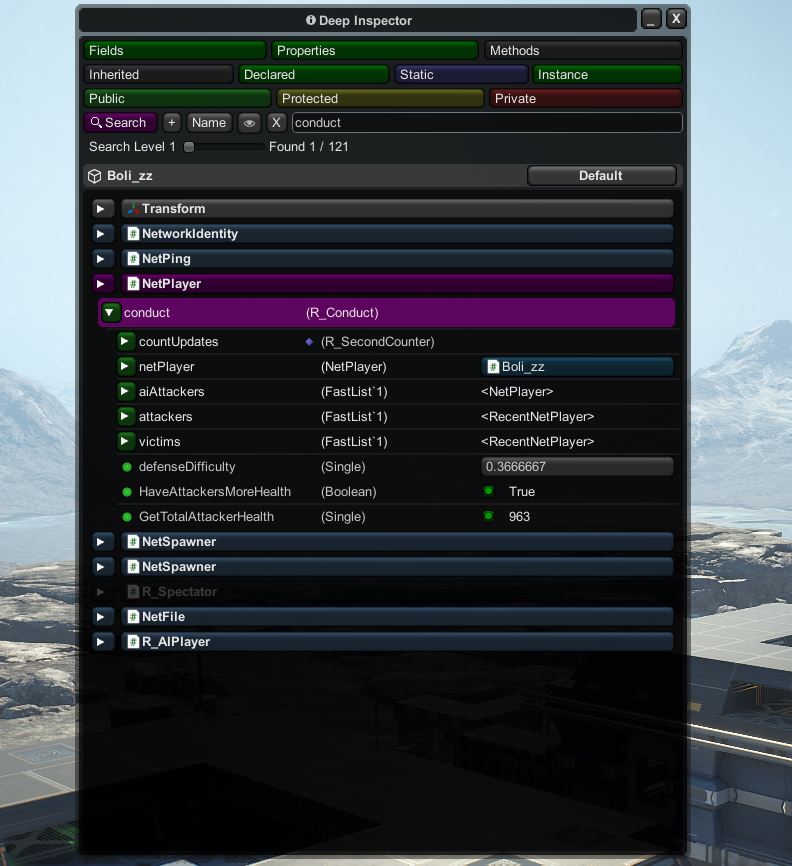
With the Deep Inspector you can check the realtime-state of all members of any object in your Scenes, Assemblies and Memory. First the name of the member shows, then it’s type, then it’s value. The key here is that everything is exposed, while Unity’s Inspector in Debug mode in the Editor only shows a little more than its default mode, but it exposes by far not everything. And in a Build there’s no way to inspect anything. Being able to see everything in Editor or in Build makes it so much more easy to debug. Also it gives a deeper understanding what’s going on under the hood. You actually will find out (if you don’t know already) what goes on inside a Transform component or that a .Net List internally is just an array (basically a new array of double size gets created if you exceed the current array length and the old is copied to the new, but most of the time there will be empty elements at the end). When clicking on a GameObject the Deep Inspector window will show it’s Components. When you unfold a component it shows its members. When a member is a Class or a Struct you can unfold it, and you can keep unfolding the members into unlimited levels. There can be an infinite loop with e.g. cross referencing. Members can be filtered based on if they are Fields, Properties or Methods and if their scope is Inherited, Declared, Static, Public, Private or Protected. For each there’s a button to show/hide the members. The scope buttons also display the color coding for the members. So blue means they are static, green public, etc. If properties have getters the Deep Inspector will show their current value, which can be super handy.
In general I don’t like the use of properties for fields unless necessary, as they come with a little performance overhead as internally they are a method and this is anti DOTS. Also I don’t like that an actual field is needed if there’s no auto setter and getter. But for replacing methods they are fine imo. I was avoiding them in general but since having the Deep Inspector I started to use more property getters instead of methods as the Deep Inspector shows their result. E.g. for an AI Bot instead of having a method ‘bool HaveAttackersMoreHealth()’ I now do ‘bool HaveAttackersMoreHealth {get{…}}’. So when I inspect the bot I can actually see the result of that method in the Deep Inspector.
Enabling/Disabling Components
This can be done with shift clicking the component.
Modifying Field and Property values
When a field or property value shows as a button it can be modified. All primitive values, strings and enums can be modified. Just click on the button to edit it. When clicking a boolean it will automatically invert the state.
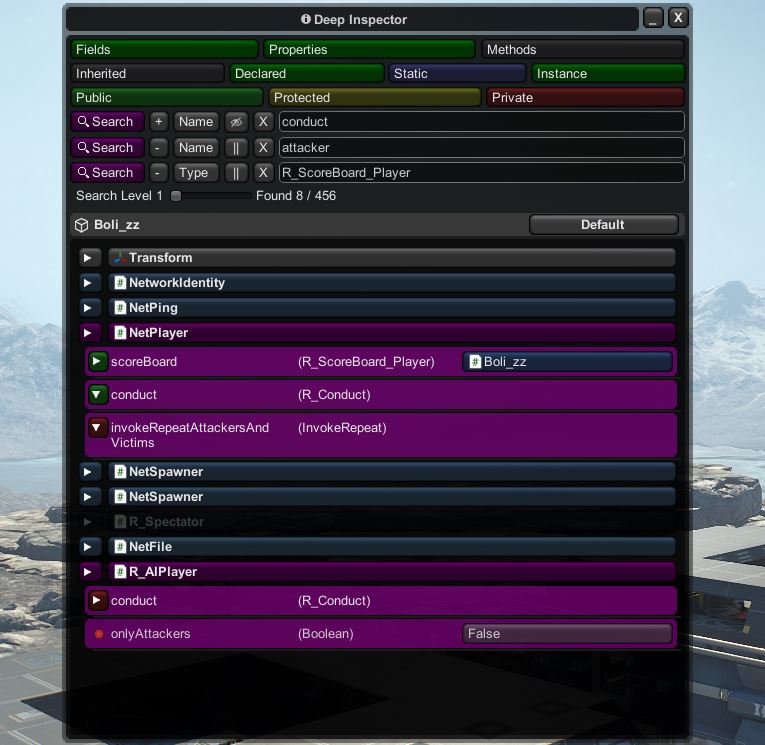
Searching inside the Deep Inspector Window
Searching works almost the same as in the Hierarchy only you need to click on a Component to add/remove it from the search query. This is done for optimizing the search speed, as searching through all component members on multiple levels can quickly become a huge list. When adding to the search query a component becomes purple. You can add multiple components. By clicking a purple component you remove it again from the search query. With the `Search Level` slider you can search inside multiple levels, e.g. inside an array or list, or inside a reference that points to another class or struct. Searching can be done until level 7, but level 3-4 will still give enough speed. You can unfold a search result or its parents to show the non found members in context with the eye enabled search mode. Keep in mind that all types have .Net reflection naming, so ‘bool = Boolean’, ‘int = Int32’, ‘float = Single’, etc.
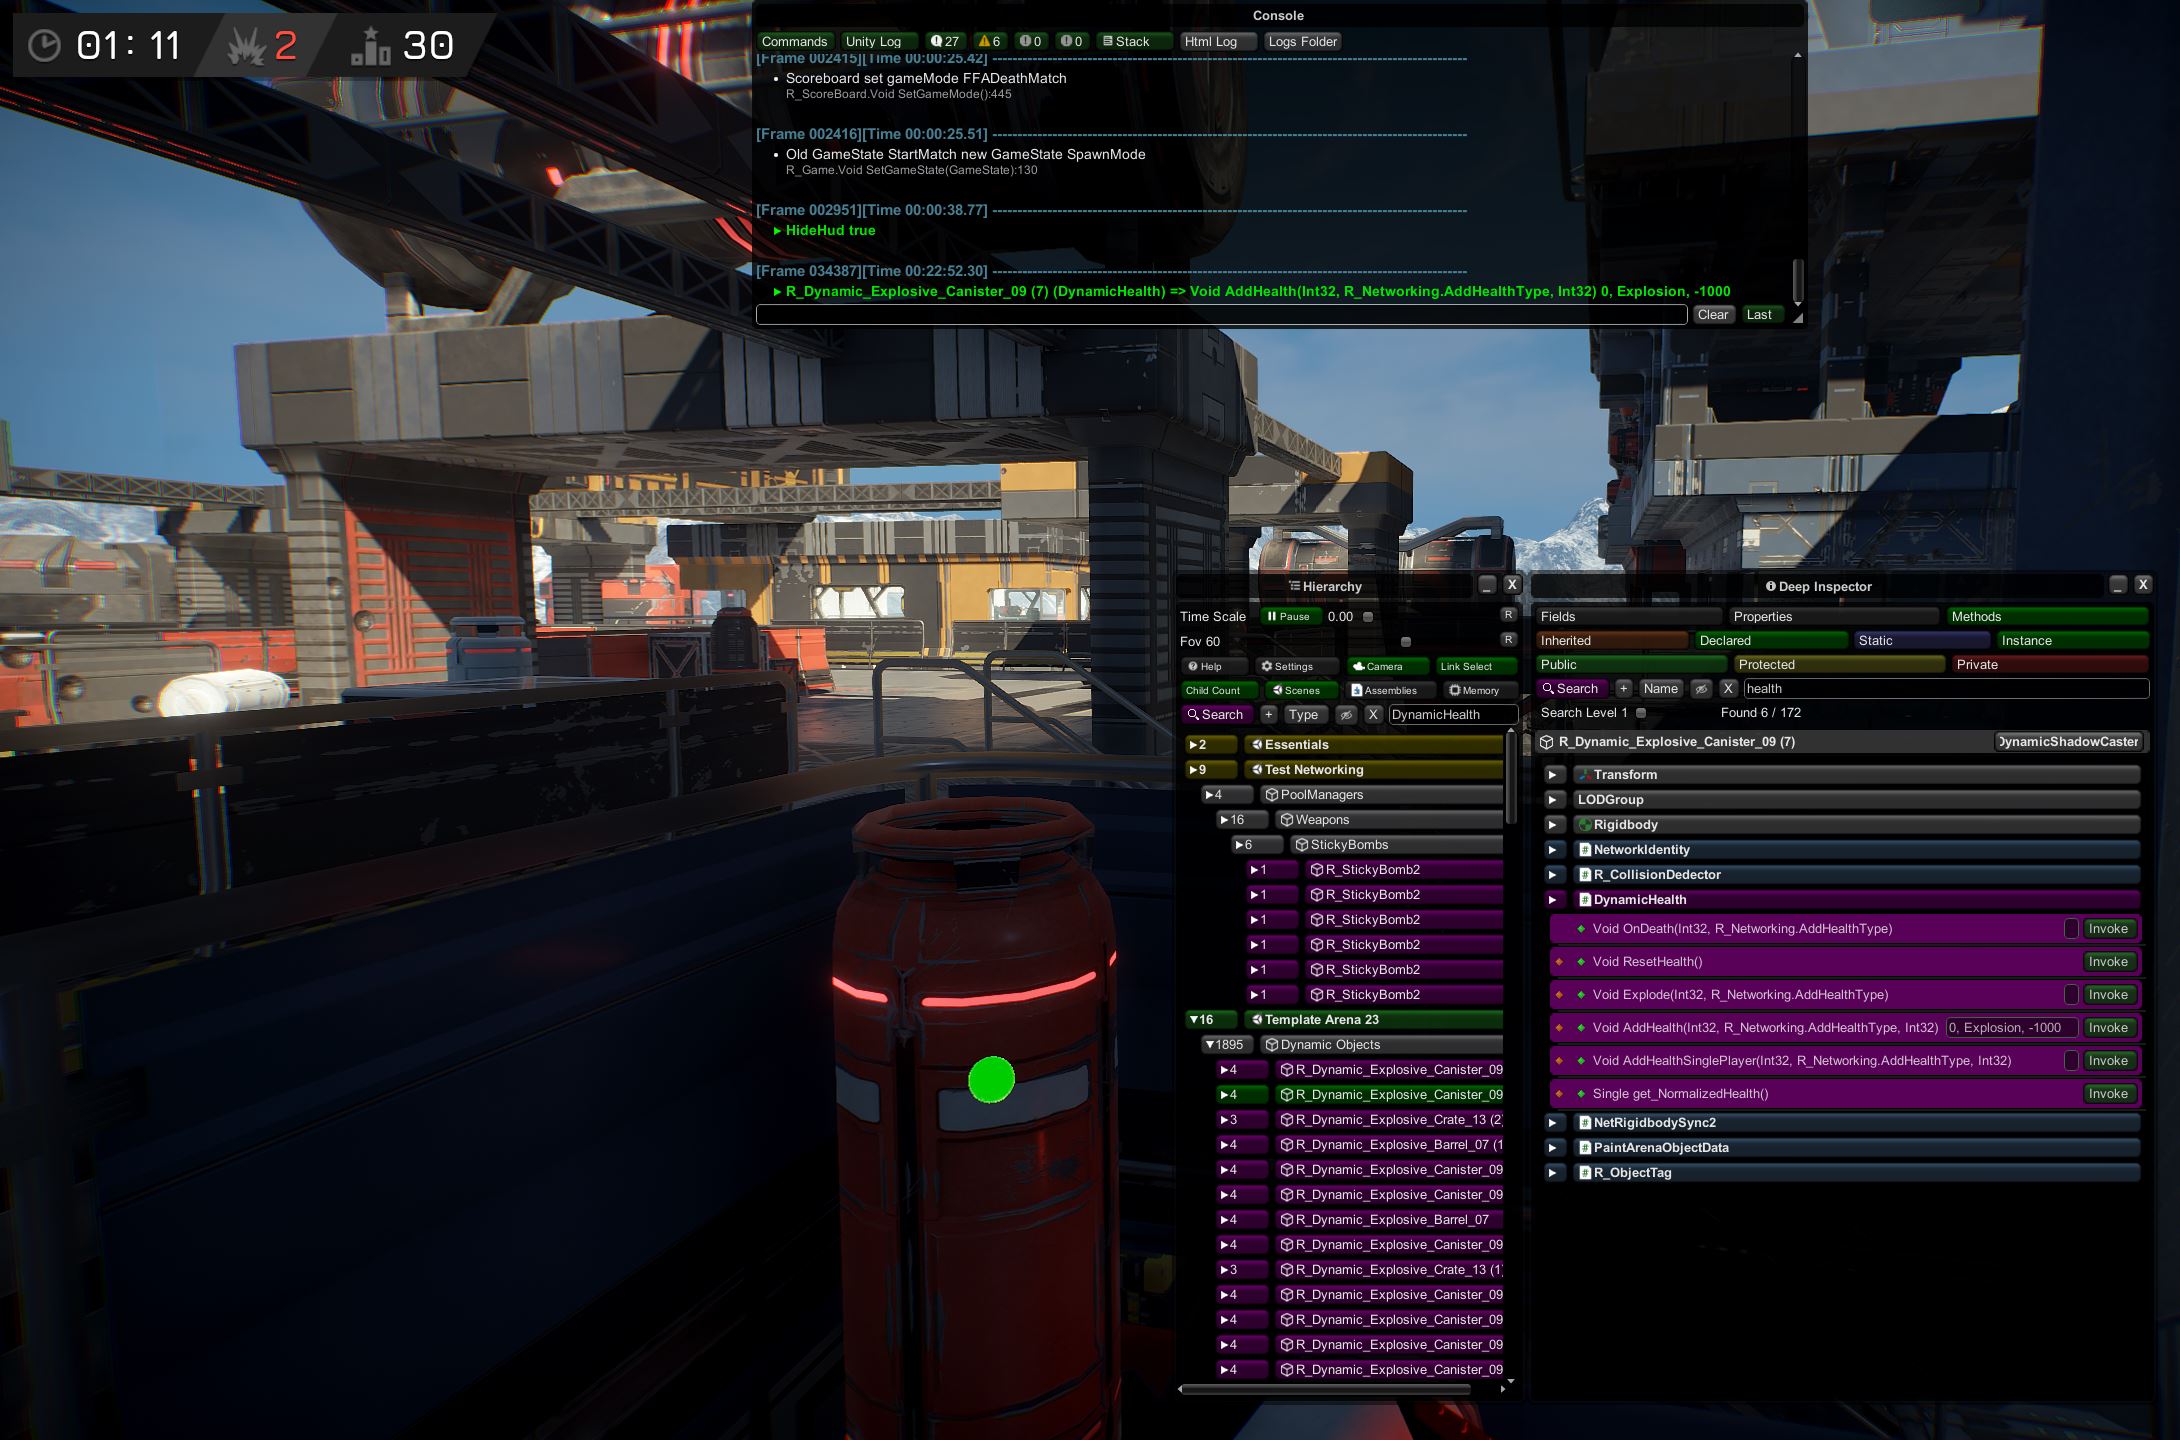
Invoking Methods
Any method with no or primitive arguments can be executed. Once invoked, the command will appear in the console. To use multiple arguments they need to be separated by either a comma or space. For a string as argument that uses a space inside it you need to put ” around it, like “Hello World”. If the method has a primitive return type, the return value will show in the console. The same parameter types can be used as in the console and which types are supported is explained in the ‘Parameters’ section of the ‘Runtime Console’ a bit below.
5.Runtime Console
Setup
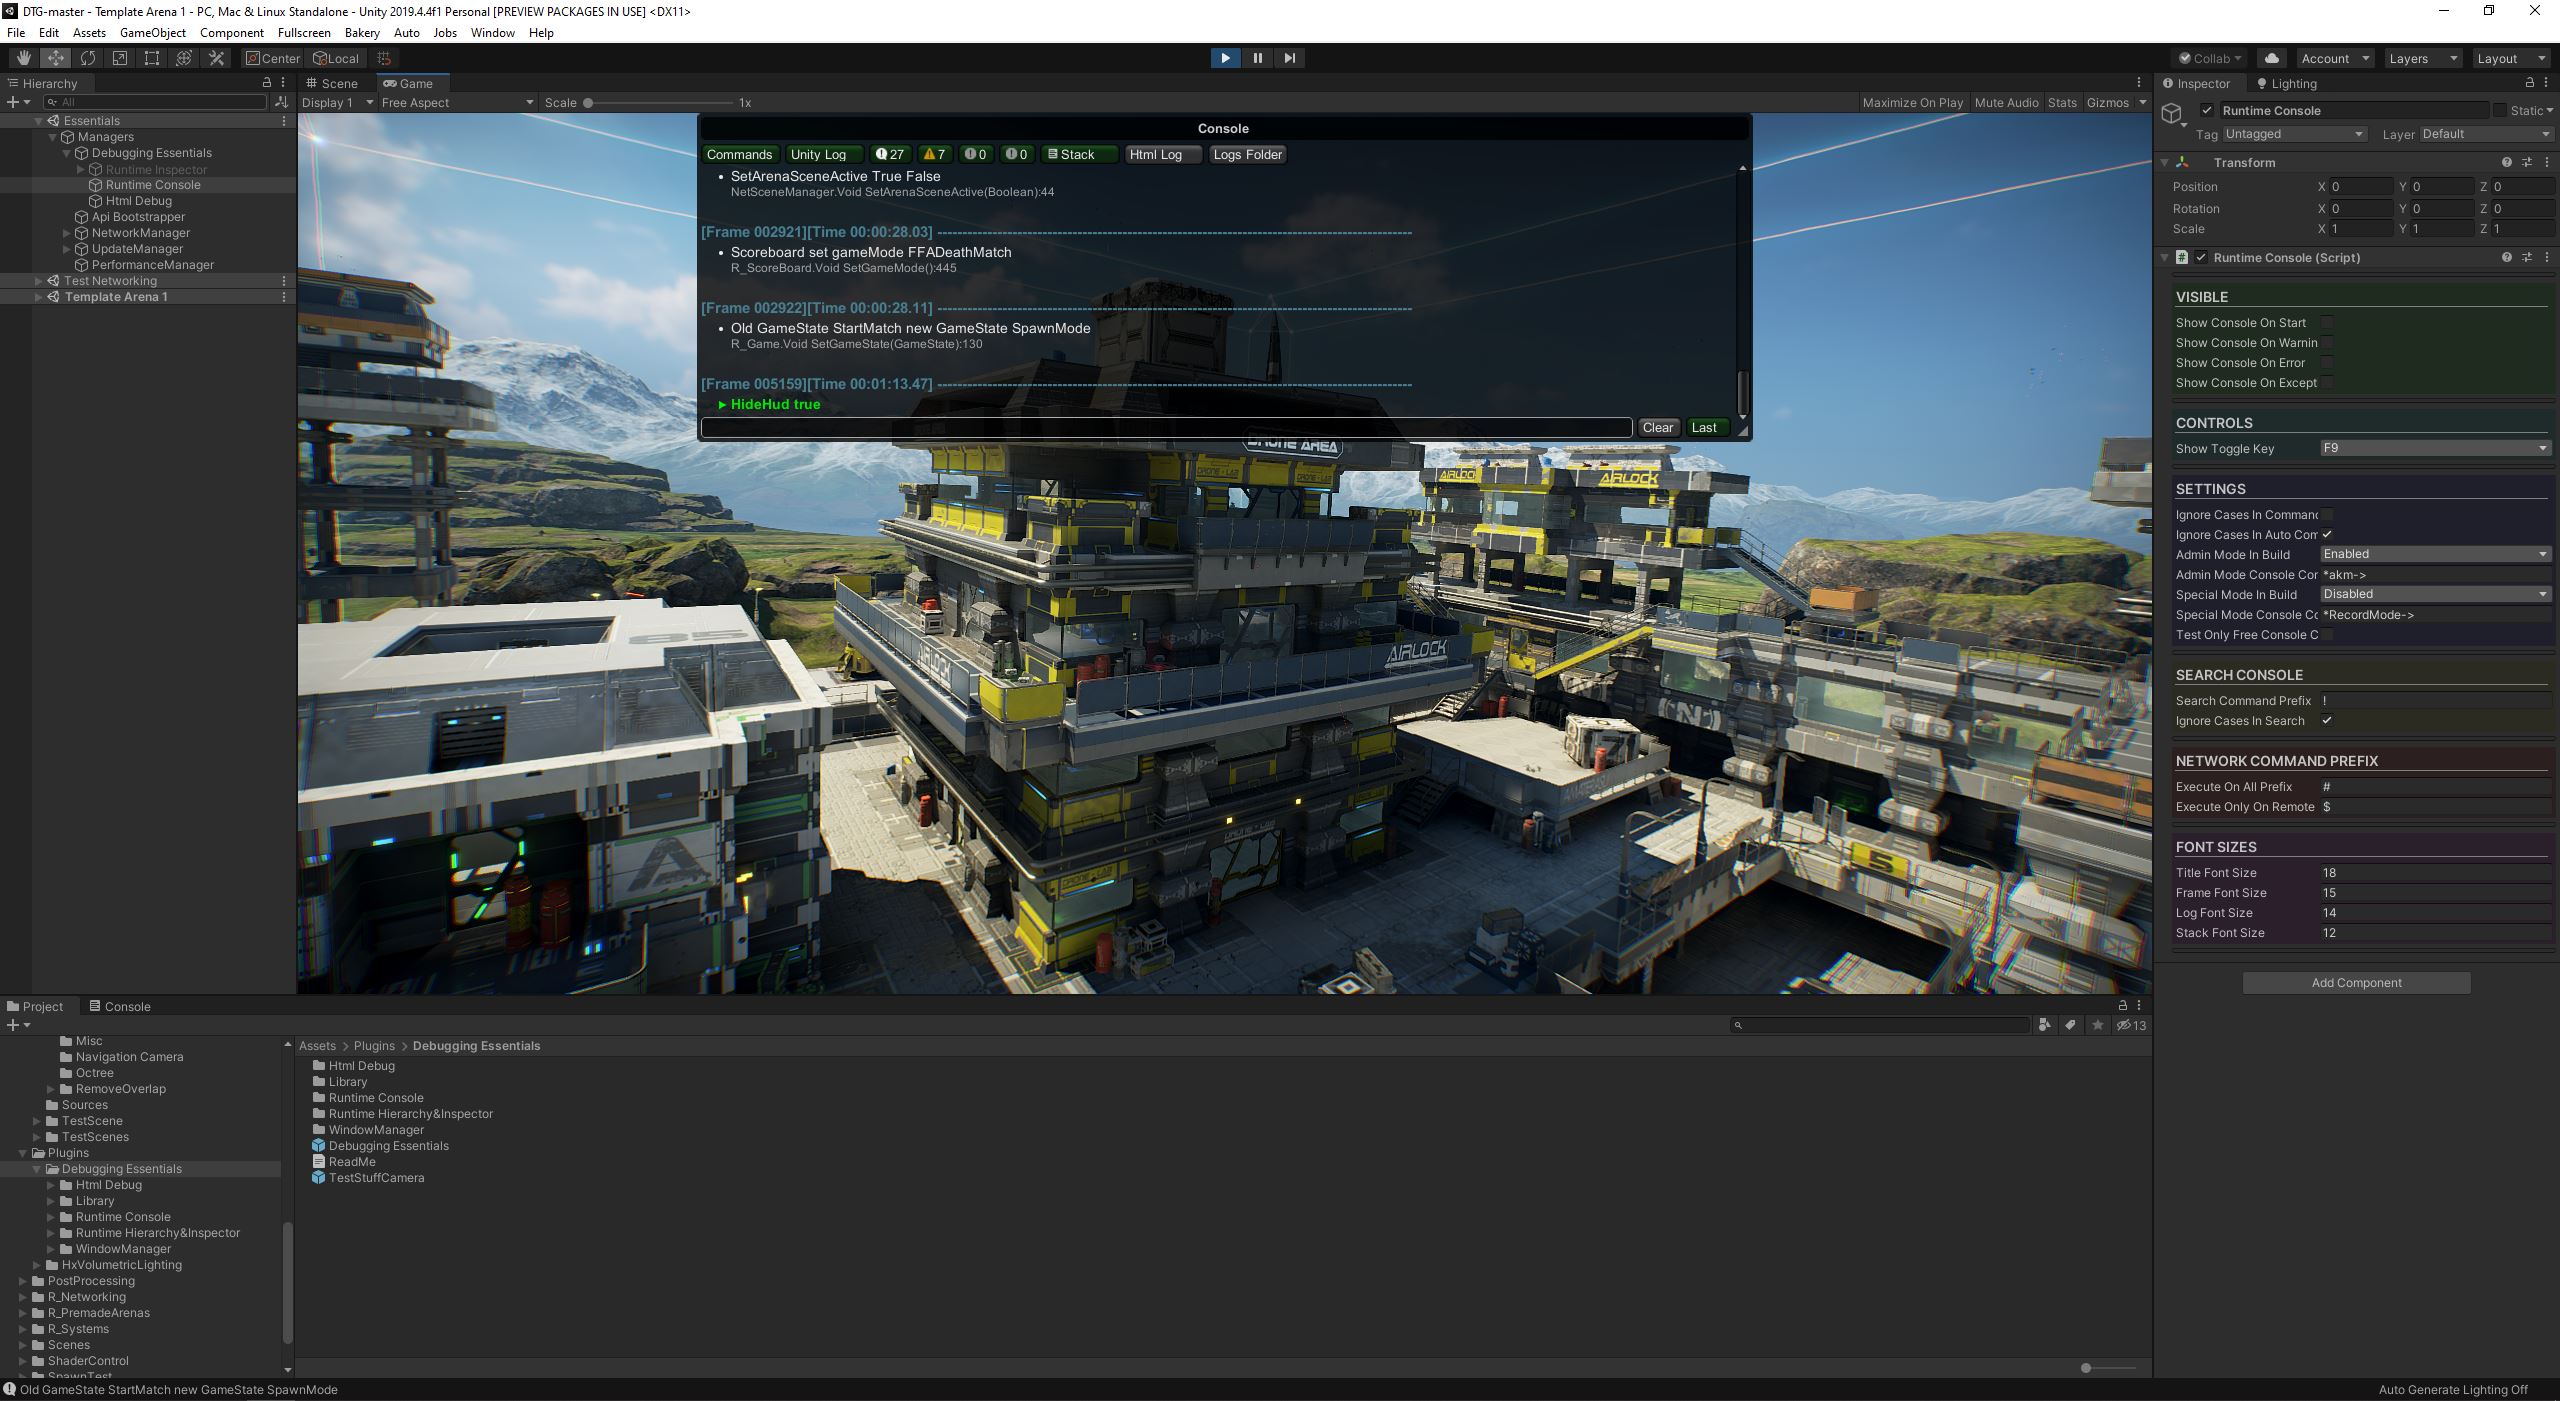
The runtime console can be toggled with the `Show Toggle Key` which can be setup in the Unity Inspector of the ‘Runtime Console’ GameObject. There are a few options which most are self explanatory. There are 3 Access Level settings Admin, Special and Free. Basically all commands on default are Admin commands. To make them Special or Free, this needs to be done with ‘[ConsoleCommand(AccessLevel.Free/Special)]’ attribute, which is explained in more detail in the commands section. You can always enable/disable admin mode in a build or only enable it once you type the text which you can setup in the ‘Admin Console Command’. On default the admin mode is always enabled in the Unity Editor, unless you enable the ‘Test Non Admin Console Commands’ toggle. We have Erosion139 from our community helping making videos for us. He made really cool cinematic Drone videos with our arena editor (our first build which is separate from our Early Access build) where we have a runtime recording system available for everyone. In our Early Access build we have our recording system and recording drone that he can enable with commands (and a few extra commands to hide the HUD, etc) in the console, because he has ‘Special’ access. He made this Drone Editor video for us. So the console is really handy avoiding making special builds for this purpose.
Controls
The console window can be moved around by dragging the ‘Console’ bar in the top. When the console is out of the top center, the ‘Dock’ button will appear and if you click it, it will automatically put the console back in the top center. You can resize the console by clicking and dragging the little triangle in the bottom right. You can also change the console height by executing e.g. ‘console.Lines 20’. If the ‘Last’ button is green it means that the console will always scroll to the last log, when dragging the scrollbar or moving the mouse wheel this button will automatically deactivate. It will automatically activate again if you scroll through to the end or if you click it.
Filter Commands and Unity Logs
The console displays Unity logs and commands. What the console displays can be filtered with the buttons below the ‘Console’ bar. These are all self-explanatory. A neat thing is that the console uses culling and only loops and renders the logs that are visible. So millions of logs can be present without any performance drop. It only needs to rebuild when you click a filter button or using the search feature. To clear the console execute ‘console.Clear’ or click the ‘Clear’ button.
Searching for Logs
You can search for logs using the ‘!’ prefix and the text after will be searched for. The search prefix char can be changed in the Console Inspector. Also you can set in the Inspector or by console command if cases should be taken into account for search text.
Network Command Prefix
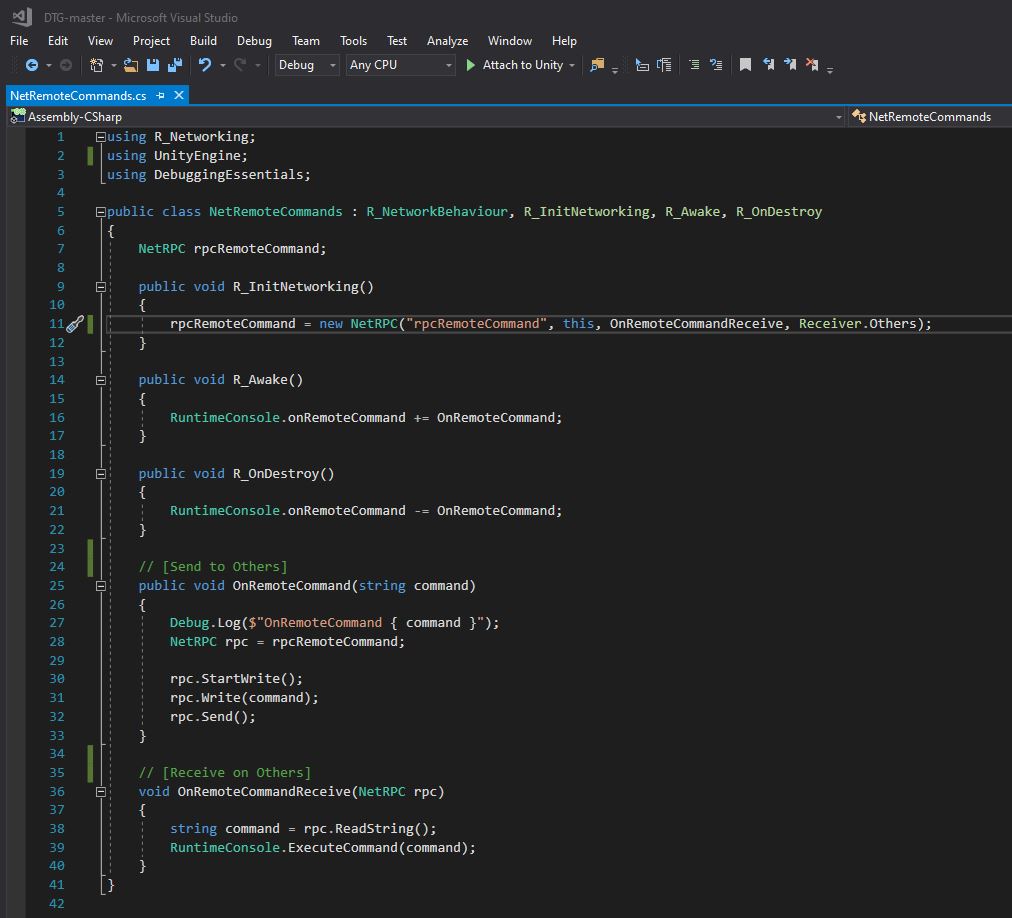
These are 2 prefixes that can be typed before a command which both trigger the ‘RuntimeConsole.onRemoteCommand(string command)’ event. In case you’re using networking you can subscribe to this event to send over the command to the other players console with your net-code. You can execute the command on the remote players with ‘RuntimeConsole.ExecuteCommand(string command)’. If you type the ‘Execute On All Prefix’ (‘#’) in the console a command will be executed on your side too. With the ‘Only On Remote’ prefix (‘$’) commands it won’t execute on your side but only triggers the event. Those prefixes can be changed in the console Inspector. The above example show this implemented with my network code the way I use it in Drone.
I’m using this a lot for offline testing with multiple Build instances. So I can setup all builds from one build console only. E.g. I made a test case that simulates a player which automatically joins a match and leaves after x seconds. Then joins again after x seconds. I use like 4 build instance (like I show in the promotion video) and this will trigger host-migration, and I let it run until something goes wrong, then with the Runtime Inspector I pause the build in which things went wrong and then inspect it with the Deep Inspector.
Commands
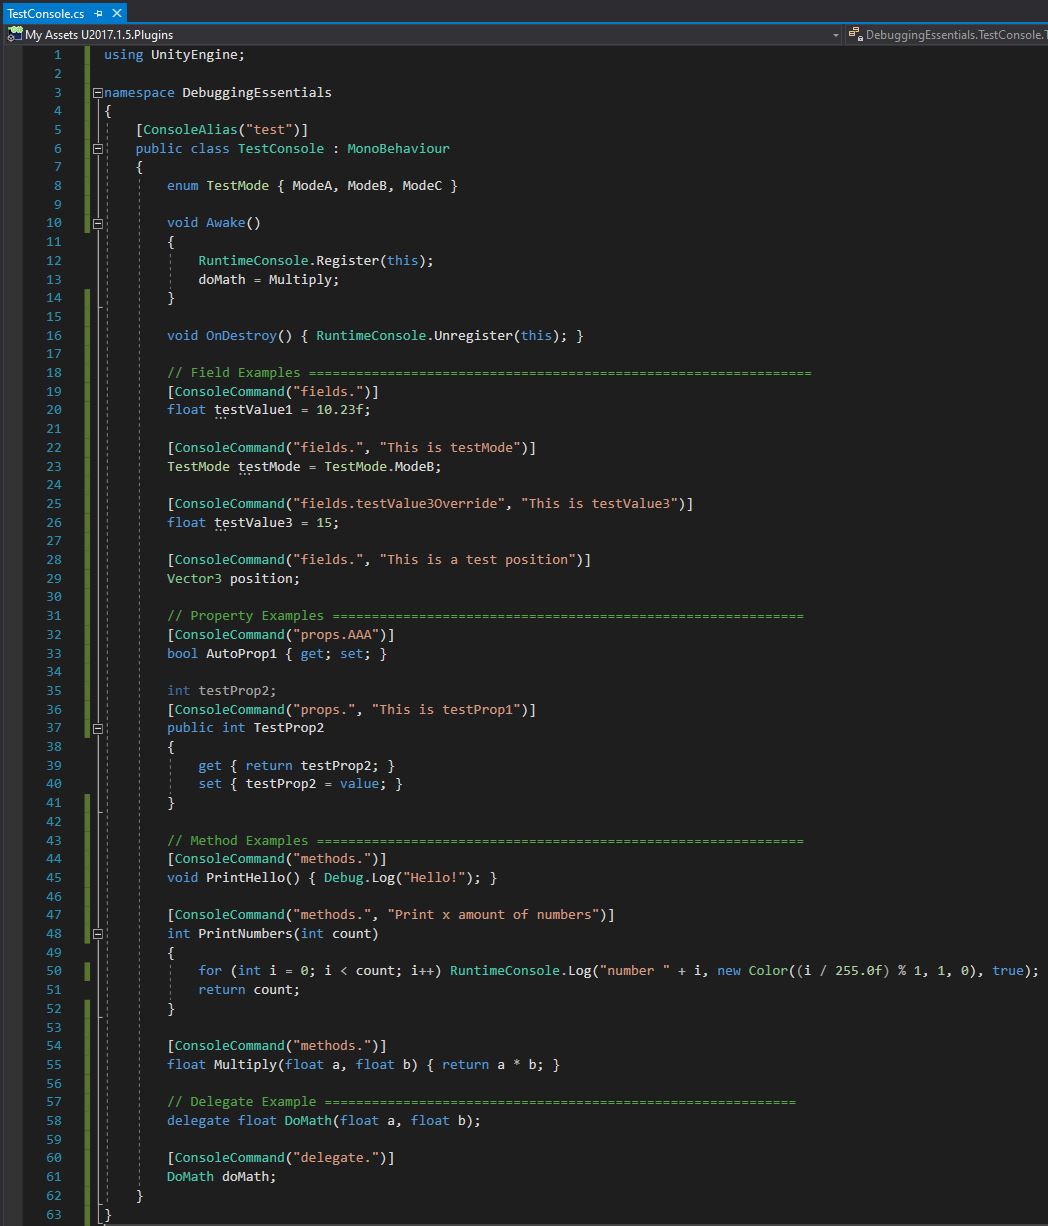
To be able to use the Console in your scripts you need to add ‘using Debugging Essentials;’ namespace in the top of your script. You can easily add your own commands by adding the ‘[ConsoleCommand]’ before your Field, Property, Method or Delegate. For anything static you don’t need to do anything more but for non-static you need to register your class instance with ‘RuntimeConsole.Register(object instance)’ and unregister your class with ‘RuntimeConsole.Unregister(object instance)’. The ‘TestConsole’ script is included and you can attach it to a GameObject in your Scene to try it out.
On MonoBehaviours you can register in ‘void Awake()’ and unregister in ‘void Destroy()’, or if you want commands to only appear when a script or GameObject is enabled use for register ‘void OnEnable()’ and unregister in ‘void OnDisable()’. You can add a description for a command in the second string parameter like this: ‘[ConsoleCommand(“”, “Description”)]
Command Aliases
A command can start with an alias to nicely sort them based on category and this works nicely with auto-completion. You can put an alias per command by doing e.g.: ‘[ConsoleCommand(“test.”)’. On default the name of the command will be the name of the member where you use the ConsoleCommand. You can override the name with ‘[ConsoleCommand(“NewName”)]. You can put a [ConsoleAlias(“something”)] above your class to put all ‘[ConsoleCommands]’ inside your class into that alias category. You can use any amount of aliases and they need to be separated by a ‘.’ e.g. ‘ConsoleCommand(“test.something.testA.NewName”).
Parameters
Any amount of parameters are supported on your methods/delegates with 1 return parameter. Parameters in the console input field are separated by spaces, so a space means another parameter. As for typing a string with spaces in between you need to use string quotation marks e.g. “Hello World”. For enum parameters in the above example you need to type: ‘test.testMode ModeC’ , so the ‘TestMode.` needs to be excluded. The following parameter types are supported:
- bool, byte, sbyte, char, decimal, double float, int, uint, long, ulong, short, ushort
- string, Vector2, Vector3, Vector4, Quaternion
- enums
Auto-complete and re-use of previous commands
The ‘TestConsole’ script above will appear like this is the console:

To auto-complete press ‘Tab’ on your keyboard or to execute before completing press ‘Enter’. You can navigate through the list with the ‘Up’ and ‘Down’ arrows on your keyboard. If you use those arrows on an empty input you can select previous commands you typed. You can also select the command on the auto-complete list by clicking the button.
Logging to console only
You can log a unlimited amount of logs with your own color directly to the console bypassing Debug.Log. This has the benefit of not affecting performance and also not creating a huge log file. To log directly to the console use ‘RuntimeConsole.Log(string log, Color color, bool showConsole = false);’.
E.g. I use this feature to test mouse and keyboard input, or the controller input values our ai bot creates. I log the input values to the console each frame, without causing the Unity Console to drop performance.
6.HTML Debug Logs
Setup
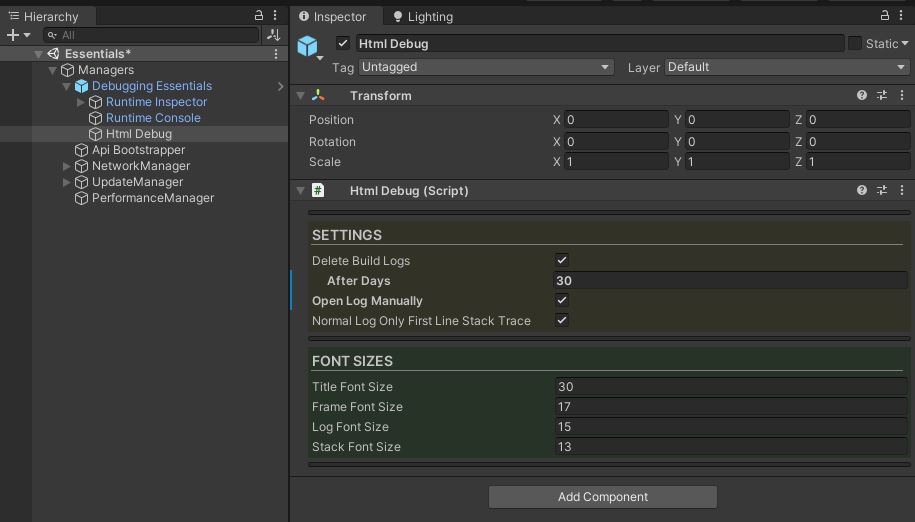
For logging to HTML file to work you only need to have the ‘Html Debug’ GameObject enabled. You can setup the font sizes for it. Build logs can automatically be deleted after x days. You can also open the log manually if you want to save logs at another than the default Unity log path. For that you need to enable the ‘Open Log Manually’ settings and you can open the log file with ‘HtmlDebug.OpenLog(string logPathIncludingFileName)’.
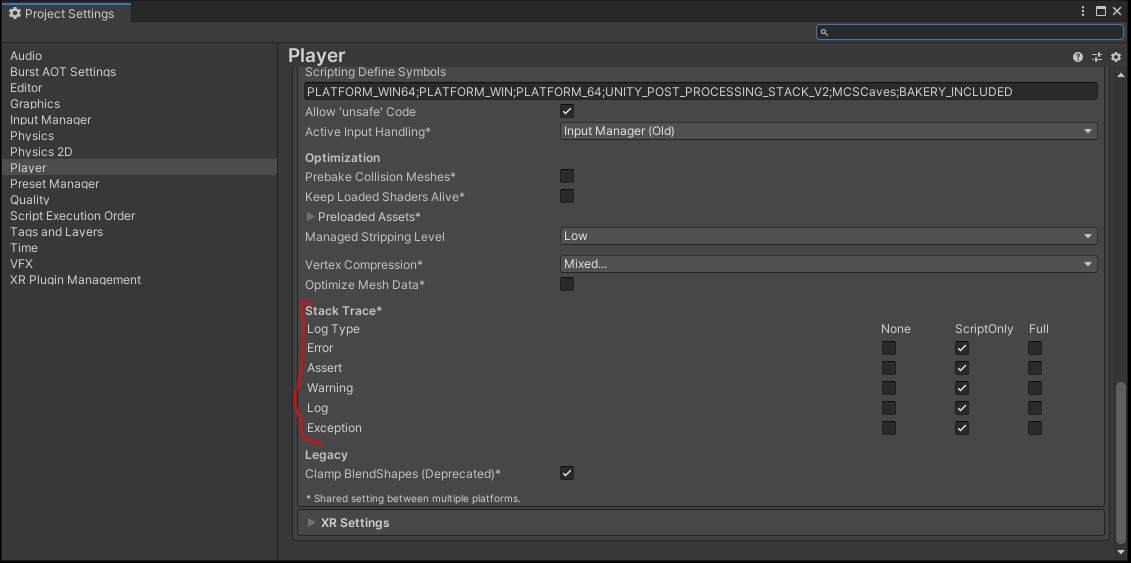
If you’re using the stack on normal ‘Debug.Log()’ you can only output the first line of the stack. For the stack settings on logs, asserts, warnings, errors and exception Unity’s ‘Player Settings’ are used. In ‘Player Settings’ you can setup the stack for each log type. The Player settings can be accessed from Unity Menu => Edit => Project Settings => Player:
Output
Logs in the Unity Editor are saved the same way in the same folder as Unity Editor logs (with a current and previous log file), but in a build they are saved by ProductName-Version-Date (also in the same Build log folder). The links to the HTML log file or folder can be found in the RuntimeConsole in play or build mode and in the Unity Editor on the ‘Debugging Essentials’ GameObject.
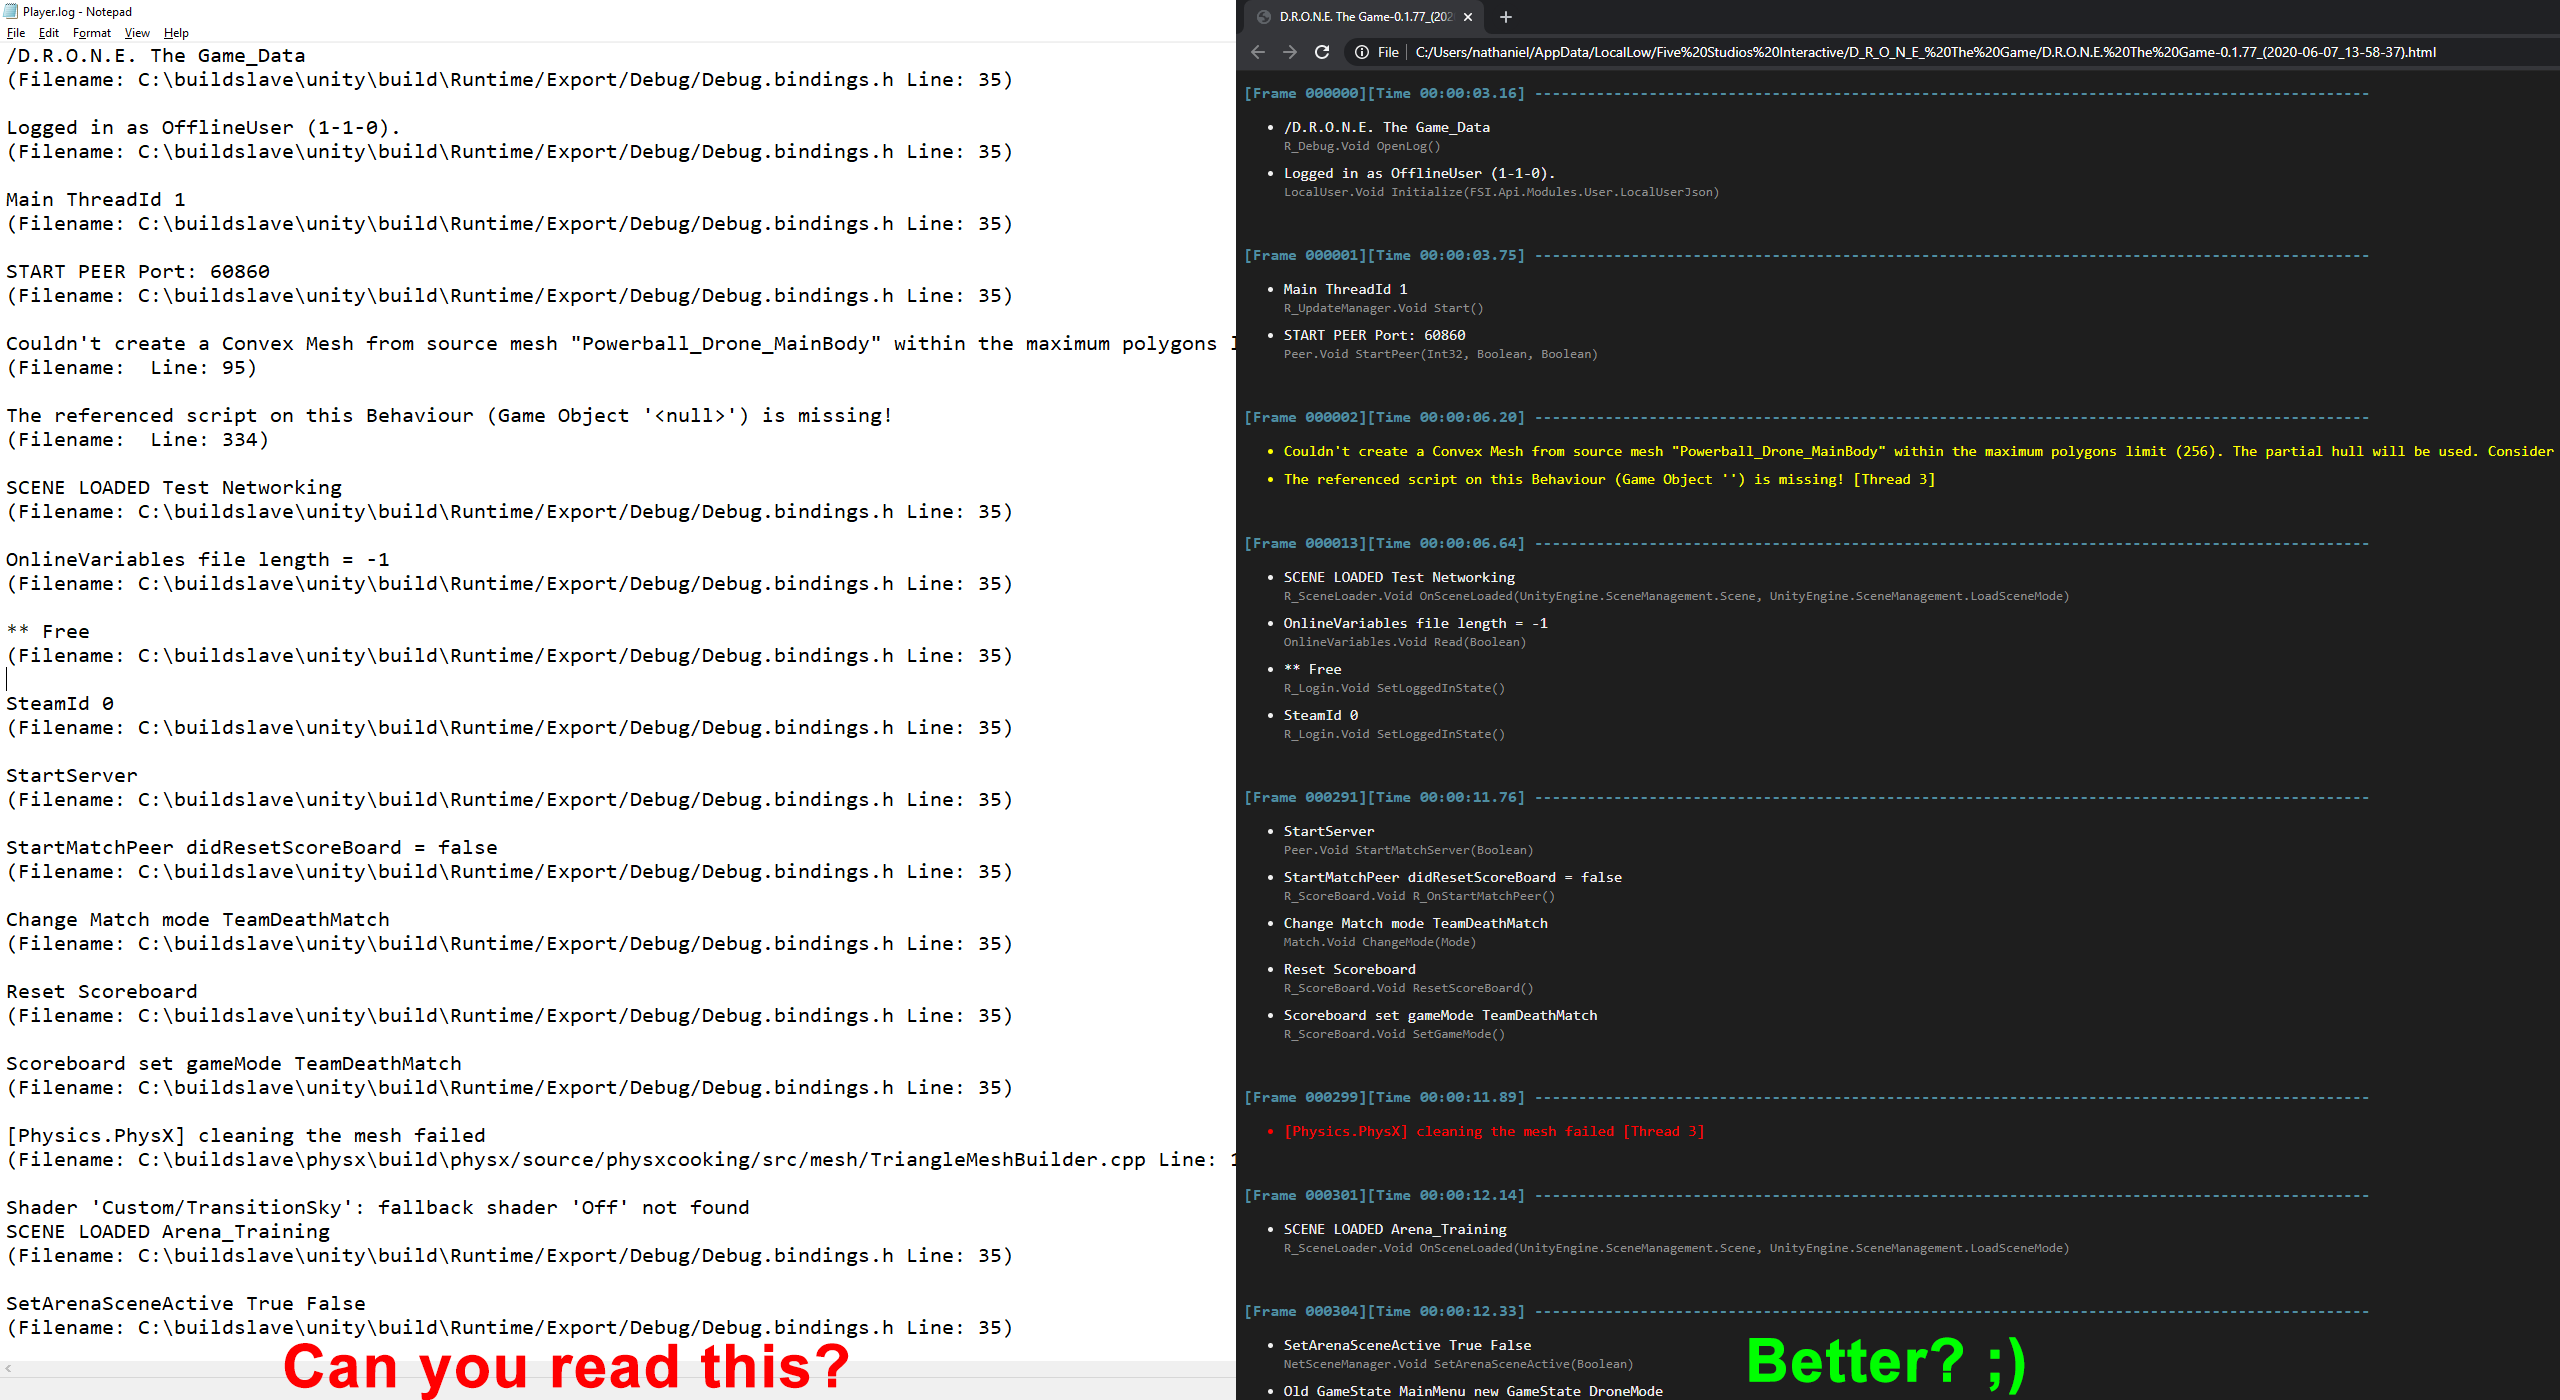
It was happening to me all the time that our community ran into issues inside the game, then I asked to send the log over and it turned out they restarted the game a few times, so the log already got overwritten. Also it was very hard for me to read the Unity log file, there are no colors or any layout, just a massive list of logs. Also when an exception happened I didn’t know in which frame-time context, which made them a lot harder to solve. That’s why I decided to create HTML log files instead, now when I receive a log I can easily scroll through until I reach a purple exception or red error.

