Debugging Essentials is available now on the Asset Store!
* Compatible with Unity 2017.x , 2018.x, 2019.x and 2020.x.
* Works with >.Net 2.0, Mono, IL2CPP and ECS (DOTS).
* Works with Native Rendering, URP and HDRP.
* Supports all platforms (PC, Mac, Linux, Android, IOS, WebGL, VR, etc).
* Can be used in Editor and Build.
* Source code included.
As lead programmer of our game D.R.O.N.E., with only 6 devs, I’m responsible for most core-coding including the network-code which I created from scratch. Our game is an arena shooter/builder multiplayer and we release it step by step through Steam Early Access. We are using our own Peer2Peer network architecture with instant host-migration in conjunction with Steam’s free relay networking.
I had a tough time dealing with our community’s reported bugs and issues where standard build-in tools weren’t enough.
Debugging Essentials contains 5 crucial tools which will save you tons of debugging hours and headaches, while making developing a lot more faster and enjoyable:
How often did it happen to you? You’re in play mode or in your build and you run into this particular issue/bug. What’s happening?? Ah I need to look at the state of these variables…Eh not possible without a restart => debug or attach => recompile => play or rebuild => reproduce => etc…There goes your time…
E.g. I was dealing with some very tricky networking/host migration bugs and was losing a lot of time making new offline test builds. Until I had enough…What if you could just easily navigate/search and deep inspect any little non-exposed variable at any moment in time?
This saved me tons of my time while making developing and debugging a lot more enjoyable:
Runtime Hierarchy Window
- NOTHING is hidden and EVERYTHING is selectable at any moment in real-time.
- Search/navigate through all your Scenes.
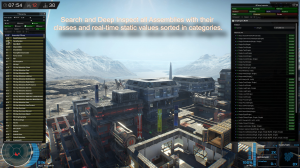
- Search/navigate all Assemblies with their classes and real-time static values sorted in categories.
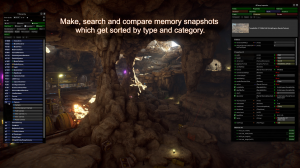
- Make/search and compare memory snapshots which get sorted by type and category.
- Multiple search conditions on name/type with intuitive search display modes.
- Disable/Enable/Delete/Duplicate any GameObject and Enable/Disable any component to e.g. test performance in a build.
- ScrollView culling, can handle thousands of objects.
Runtime Deep Inspector
- NOTHING is hidden and EVERYTHING is inspect-able at any moment in real-time.
- Inspect ALL members (fields/properties/methods) on any Assembly- and Memory Object/GameObject/Component/Class/Struct, etc.
- Deep Inspect ECS (DOTS).
- Deep Inspect inside Arrays, Lists, Queues, Dictionaries, HashSets, etc.
- Deep Inspect into unlimited levels.
- Filter based on Fields, Properties, Methods, Inherited, Declared, Static, Instance, Public, Private and Protected.
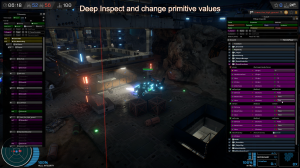
- Change primitive values.
- Execute methods with primitive arguments.
- Multiple search conditions on name/type with intuitive search display modes.
- Deep search into multiple levels.
- ScrollView culling, can handle thousands of members.
Runtime Camera Navigation
- Override your camera at any moment to navigate through your game view with the same controls as in the Editor Scene View.
- GameObject selection and focus for Deep Inspection.
- Follow moving GameObjects while still being able to navigate around.
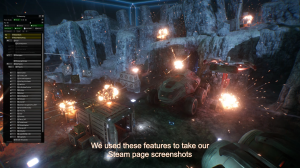
- Time Scale adjustment to slow-mo or pause your game for Deep Inspection. While the camera keeps working the same. We used this feature to take our D.R.O.N.E. Steam Store Page screenshots.
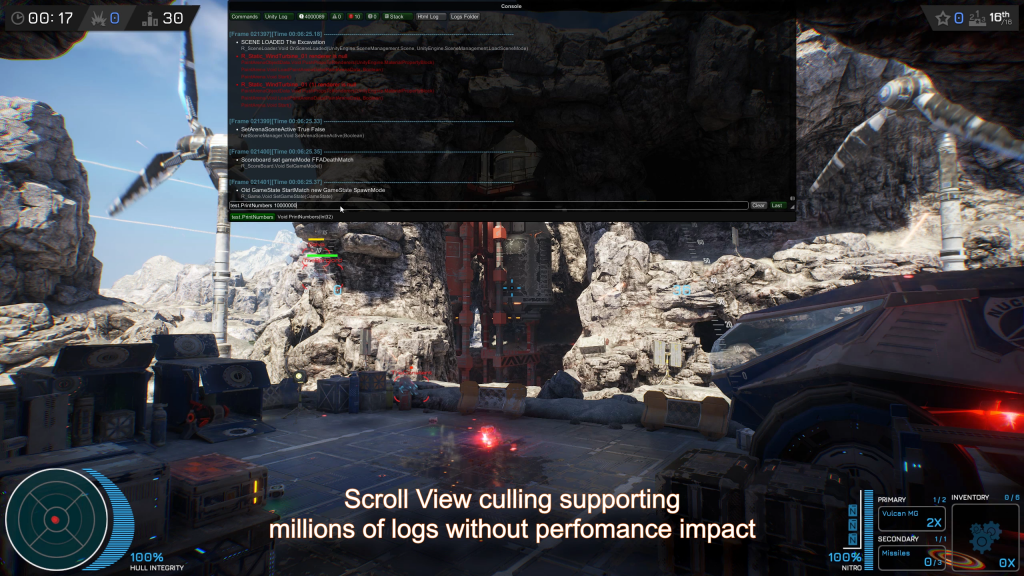
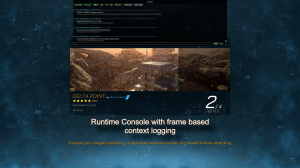
Want to easily adjust/execute anything at runtime with your own created commands? Want to see Unity’s or your own logs at runtime? I’m using the Runtime Console all the time for testing/debugging in conjunction with the Runtime Hierarchy and Deep Inspector.
Runtime Console
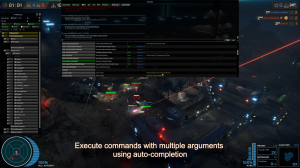
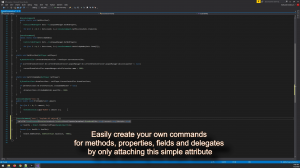
- Easily create your own commands for methods, properties, fields and delegates by only attaching a simple attribute.
- Command parameters and default parameters.
- Static and instance commands.
- Admin and non-admin commands.
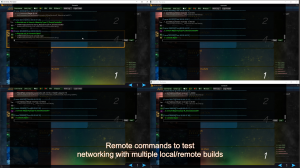
- Remote network commands.
- Command suggestion, auto-completion and displays values on fields and properties.
- Shows Unity logs in Editor/Build.
- Filter based on Commands/Logs/Warnings/Errors and Exceptions.
- Show/Hide Stack.
- Search for any logs with certain text.
- Supports logging on other threads.
- Quick links to Editor/Build logs.
- ScrollView culling, can handle millions of logs without affecting performance.
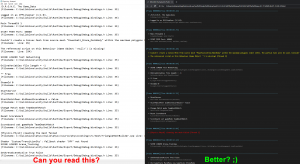
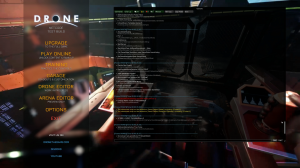
Can you read the player build Log files to find issues? With my HTML Log files you don’t want to look at them again…See first screenshot for the difference.
HTML Debug Logs
- Log files can be can opened in any browser.
- Logs display inside a frame and time header so you can see when something happened.
- An actual layout on the logs instead of a bulk list.
- Log colors make them easy to spot while scrolling through.
- Stacks lines are nicely sorted.
- Supports logging from other threads.
- Multi-threaded, writes the log file from another thread.
Another issue solved => Player: “I had an issue with the game last night” => Me: “Can you send me your log file?” => Player: “Here it is” => Me: “It’s from today, it got overwritten…”.
- Logs are saved by version and date, while normally build logs get overwritten with restarting the game.
- Logs can automatically be deleted after x days.

